
MARKET COMMENTARY
A strong week globally for equity markets really added fuel to the ongoing bull market. As COVID fears moved into the rear-view mirror for now, the markets continued to rally. While the NASDAQ tested the same highs three days in a row, it continues to hold near the old highs of February. As I mentioned on the video, volume was almost miraculous, soaring to big levels. While I continue to be amazed that debt doesn’t matter, I must be looking for trouble at a party, instead of just enjoying the party.
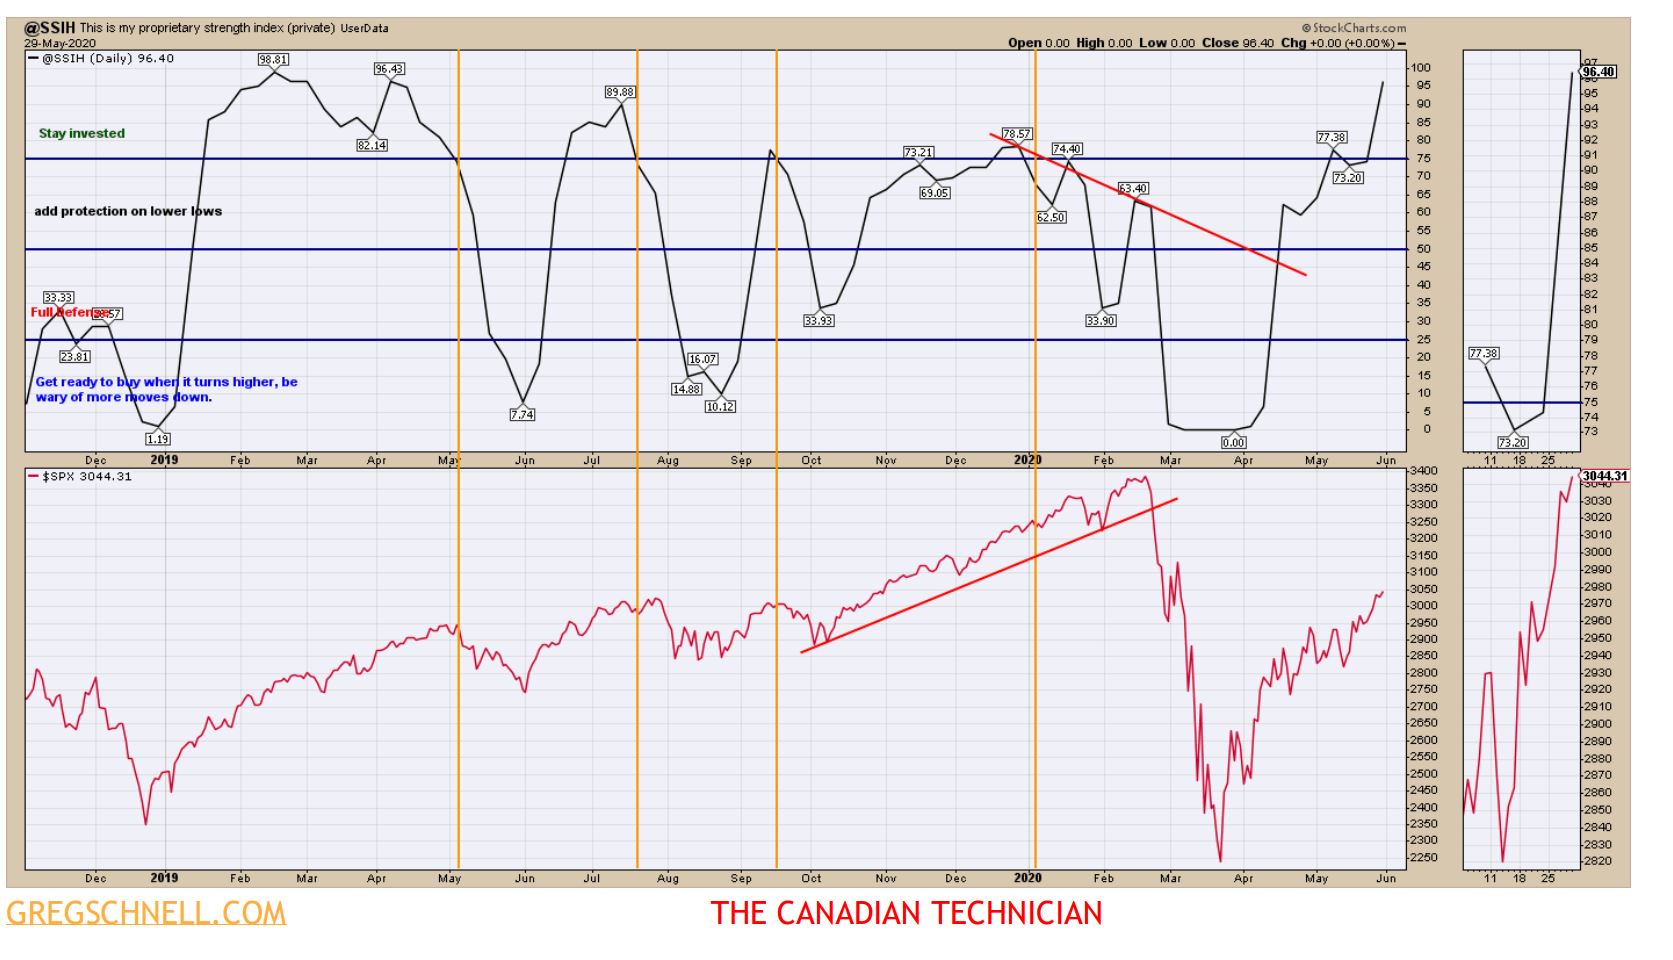
This week the Schnell Strength Indicator moved up significantly to 96%. 20% of my data set improved from negative to positive! When momentum is this bullish, it is a strong backdrop. In January 2019, it took 3 weeks to reach this level of momentum off the lows and it lasted 4 months. During this rally it took 10 weeks to get here with a big surge this week. I can’t predict what will happen but it is very positive. Historically, momentum this strong usually has to wane before the market can drop meaningfully, so this is a very bullish development. As bizarre as the world is, investors are bullish globally. The big news this week, was the S&P 500 moving back above the 200-day moving average, which is considered a simple long-term method of defining a positive market or a negative market. Smoother markets above the 200 DMA would be nice. While it was a positive development, lets make sure it holds above it this week. The Nasdaq has work to do too. Japan moved up 1500 points or 7% this week, on more borrowing and central banking activities. Europe moved up on rumours of creating more debt as Europe needs time to implement everything with the EU approvals process. Last week I mentioned: “If the globe is going to stall out here, it’s technical analysis 101. What was support, becomes resistance.” So far, no stalling, but the Nasdaq does need to take out the prior high. China rallied just enough this week to stop a sell signal on the monthly charts. Metals have a nice rally starting or going in the case of lithium.
Summary: The commodities rally looks ready to run, look there. A rotation away from the big tech names appears to be underway as the rally broadens out. That doesn’t mean they won’t rise. It just means investors are looking at other areas too.
Let’s jump into the charts.
@SSIH – IMPROVING SIGNAL
The Schnell Strength Index finally went all-in bullish. All of my breadth measurements had a meaningful strong week. Over 1400 stocks were up big this week. That’s hard to argue with. Last week, thousands of stocks were surging more than 5%. It’s very bullish. Looking at the SPX chart at the bottom, we have left the consolidation zone behind as well as the 2019 summer season peaks. When the SSIH starts dropping below 75%, we’ll get more cautious. Wiggles aside, the trend is higher as the economic data starts to
improve from a very low level.
$SPX – S&P 500
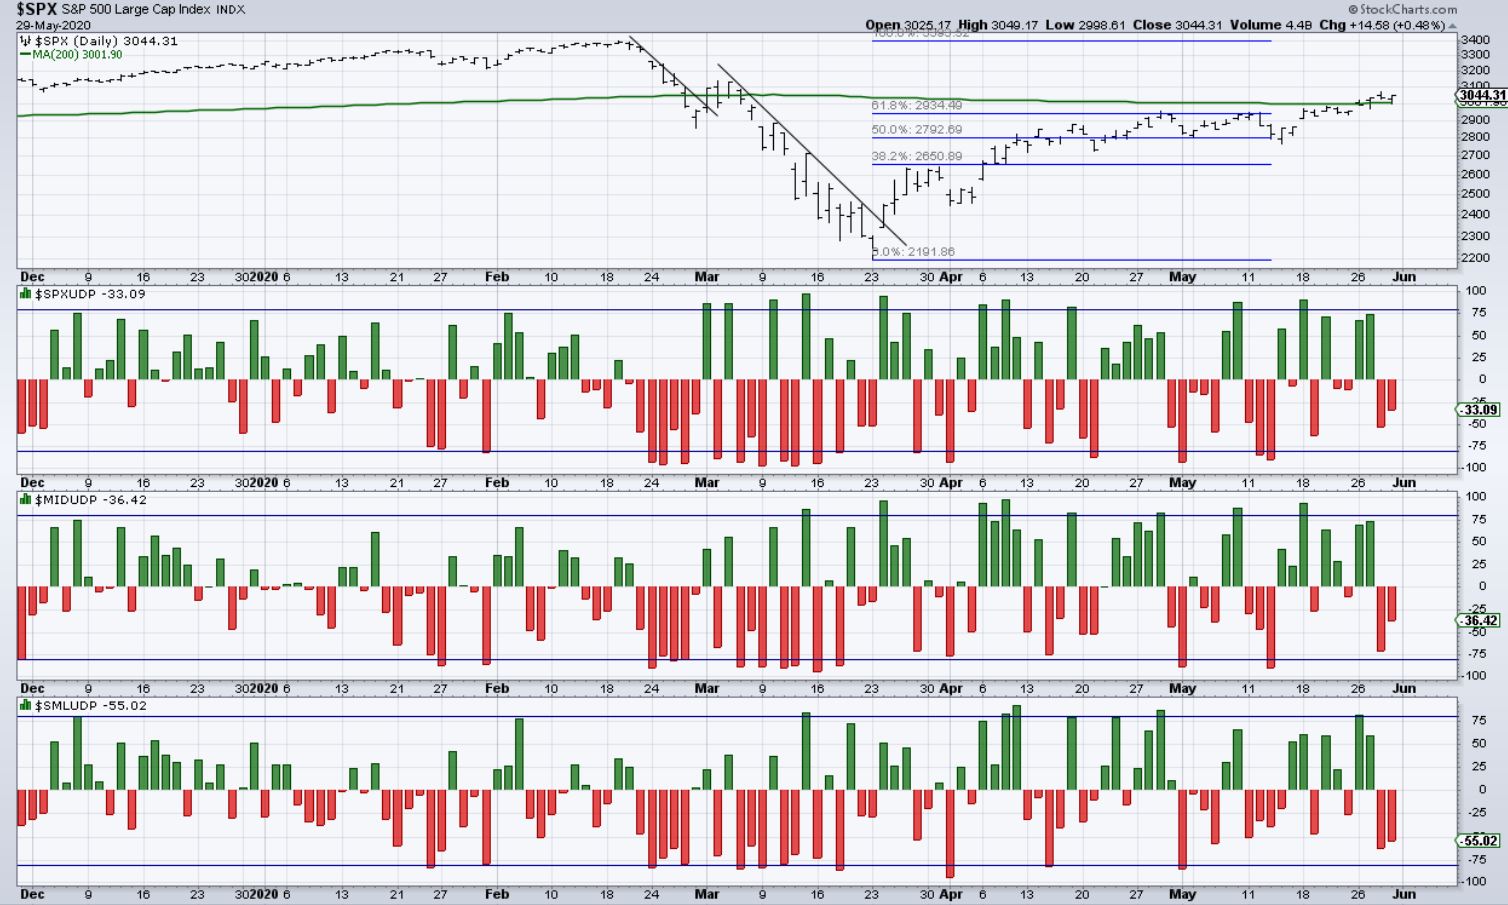
The S&P 500 moved above the 200-day moving average this week. Notice how far below the level we were when this rally started. This makes the rally look so easy when we squish it! The May 14th Thursday low was where we really turned the corner. That looks like a test of the 50-day moving average in the rear-view mirror. Two large over-the-weekend futures surges have really pushed higher. Notice the high volume on Friday May 29. Most of the previous volume spikes are on quad Options Expiration (March, June, Sept, Dec). I did not think this market would go straight up, but the central bank reality distortion field has really been unbelievably powerful in the face of grim data. Full Stop! Blind faith in the Fed? At this point, we’d have to say yes.

ADVANCE/DECLINE DATA
Inside the advance/decline data, the last two days look weak compared to the backdrop of bullishness above. In order – S&P 500, Midcaps and small caps. After moving above the 200-day moving average, there have been more declining stocks than advancing. It has been a 300-point move in 10 days, so if the market pulls back, who would be surprised? On this chart you can see that
May 14th low was at the April 9th high which was also near the 50% Fibonacci retracement zone. A small pullback but higher.
WEIRD VOLUME FRIDAY
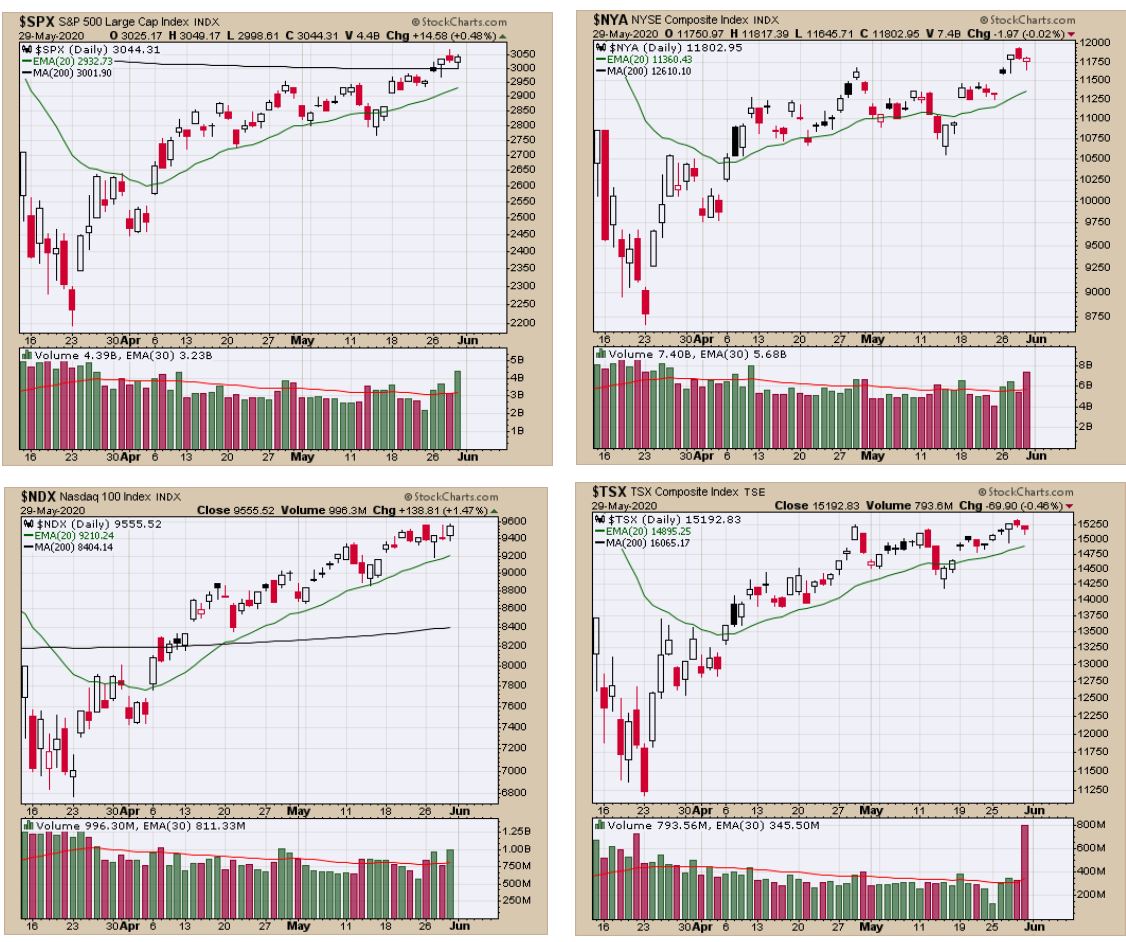
The weird volume surge on the $SPX showed up on the Canadian market as well. (bottom right). Was it just institutional investors finally buying in now that the rally had the big index above the 200-day MA?
The black 200 day moving average does not appear on the $NYA or the $TSX so we are well below for both
of those indexes. The Nasdaq 100 is clearly the most powerful index, and the volume was above average,
but there have been 7 ~1 Billion days since April 1. Only institutional buyers can change the volume profile. Retail traders come and go, but the big money goes to work with volume. My guess is they were buying shares, not selling into the rally. There is obviously a buyer for every share sold. When volume increases it is easier for an institution to establish a large position without pushing the price up too quickly. Conversely, selling into a rally is the easiest way to maximize your average selling price. Extreme high volumes and low volumes can be advance clues to price change. Keep watching in case this euphoria is the opportunity for big money to sell.
$KBE – FINANCIALS HAVE A GOOD WEEK
Financials rallied on the week as a supportive catalyst for the market to continue going higher. While the price bar isn’t the best after giving up the top half of the price bar, it was clearly a breakout above the closing prices around the $22 level for 6 weeks. An almost 7% gain is fabulous. As the number of delinquent mortgages and loans continue to pile up, it seems remarkable, but I guess the Fed can step in at any time and buy those too. That’s sounds flippant, but the Fed buys Junk bond ETF’s now so what is the difference? If the banks have limited downside, it makes sense for the market to trade higher as the economy starts the recovery.
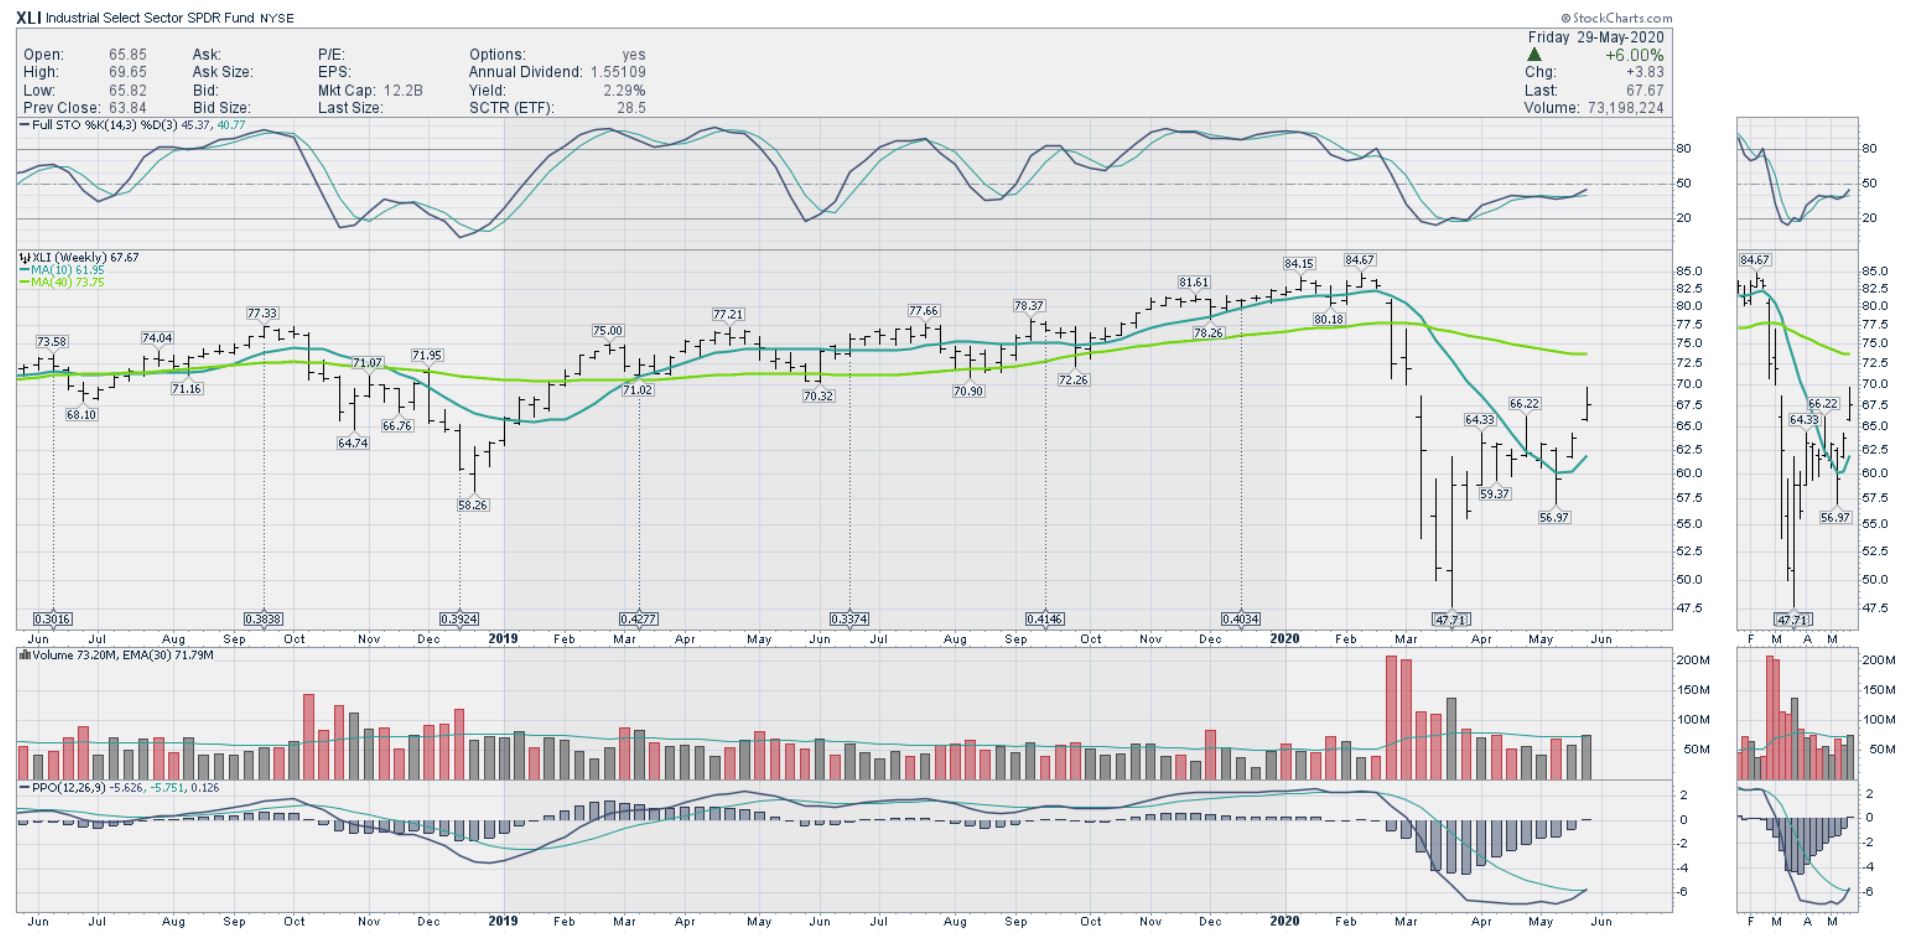
XLI – INDUSTRIALS
If this market is ready to turn the corner, the manufacturing sector should be picking up. It was another strong week for the industrials. This is helpful, and the improvement here should reflect some demand improvement for the industrial metals and the associated commodity related sectors as bullish. Link. We’ve been looking for this rally for weeks and now it is showing up.
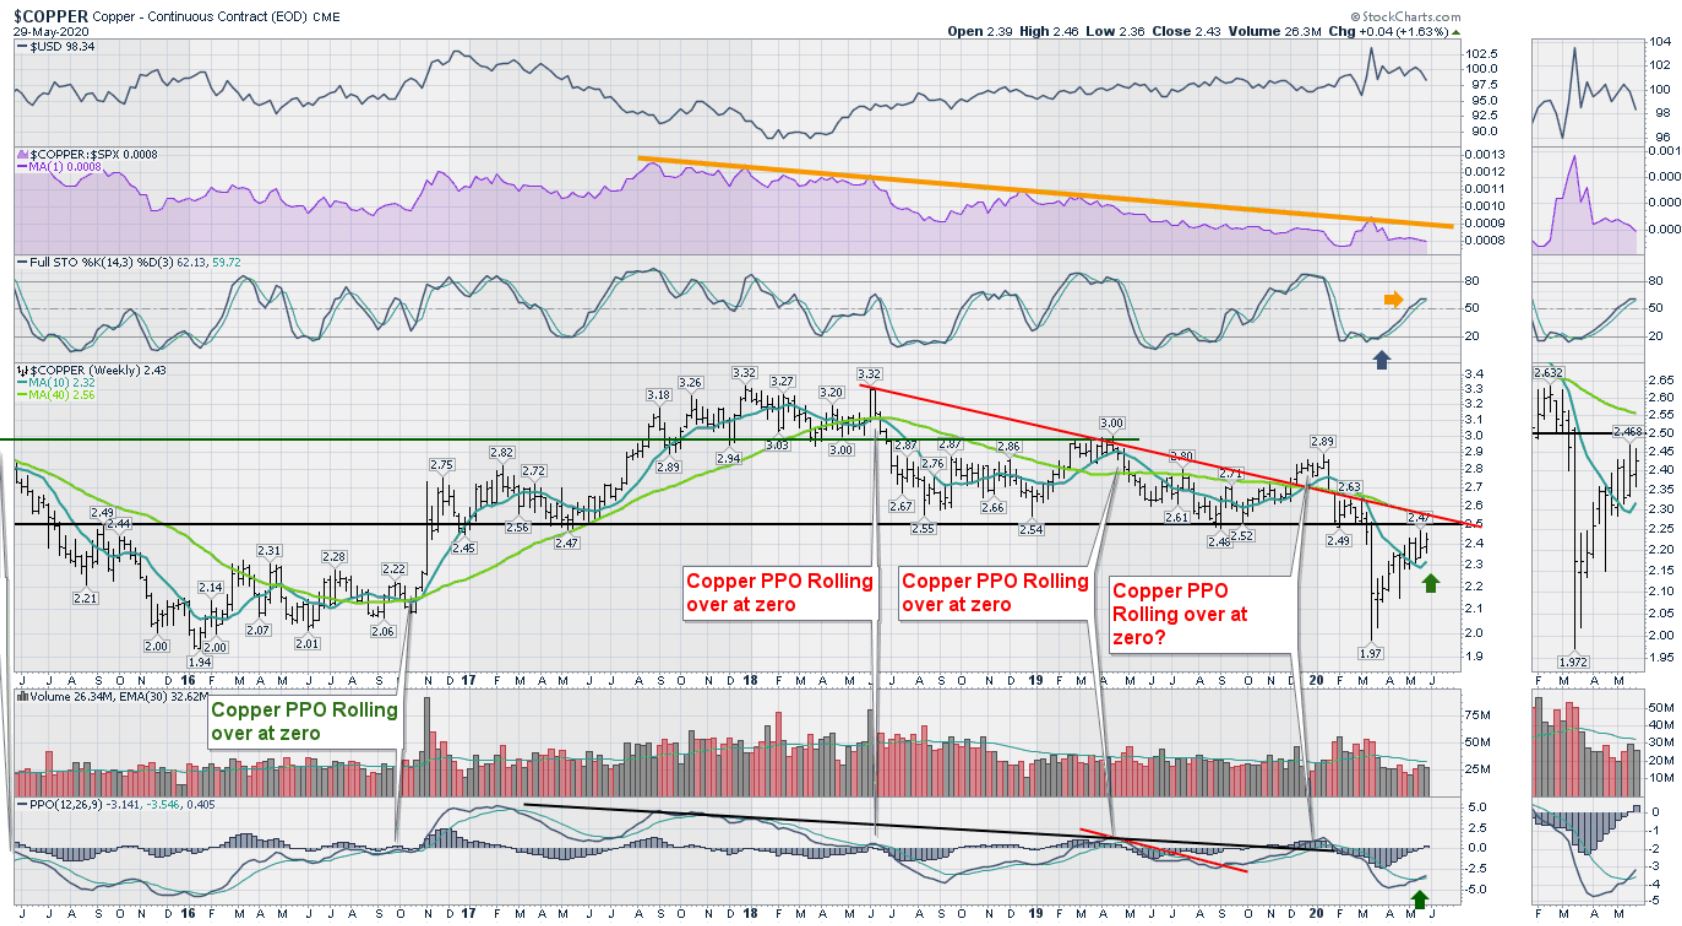
$COPPER
Copper was up on the week. How much rally energy shows up here is very important. All of the technology and communications stocks that are so very bullish rely on strands of copper everywhere. The move to electric cars, the grid infrastructure power output increases and a move away from liquid energy generally, all rely on Copper too. It is one of the theme areas I like. More on the monthly conference call.
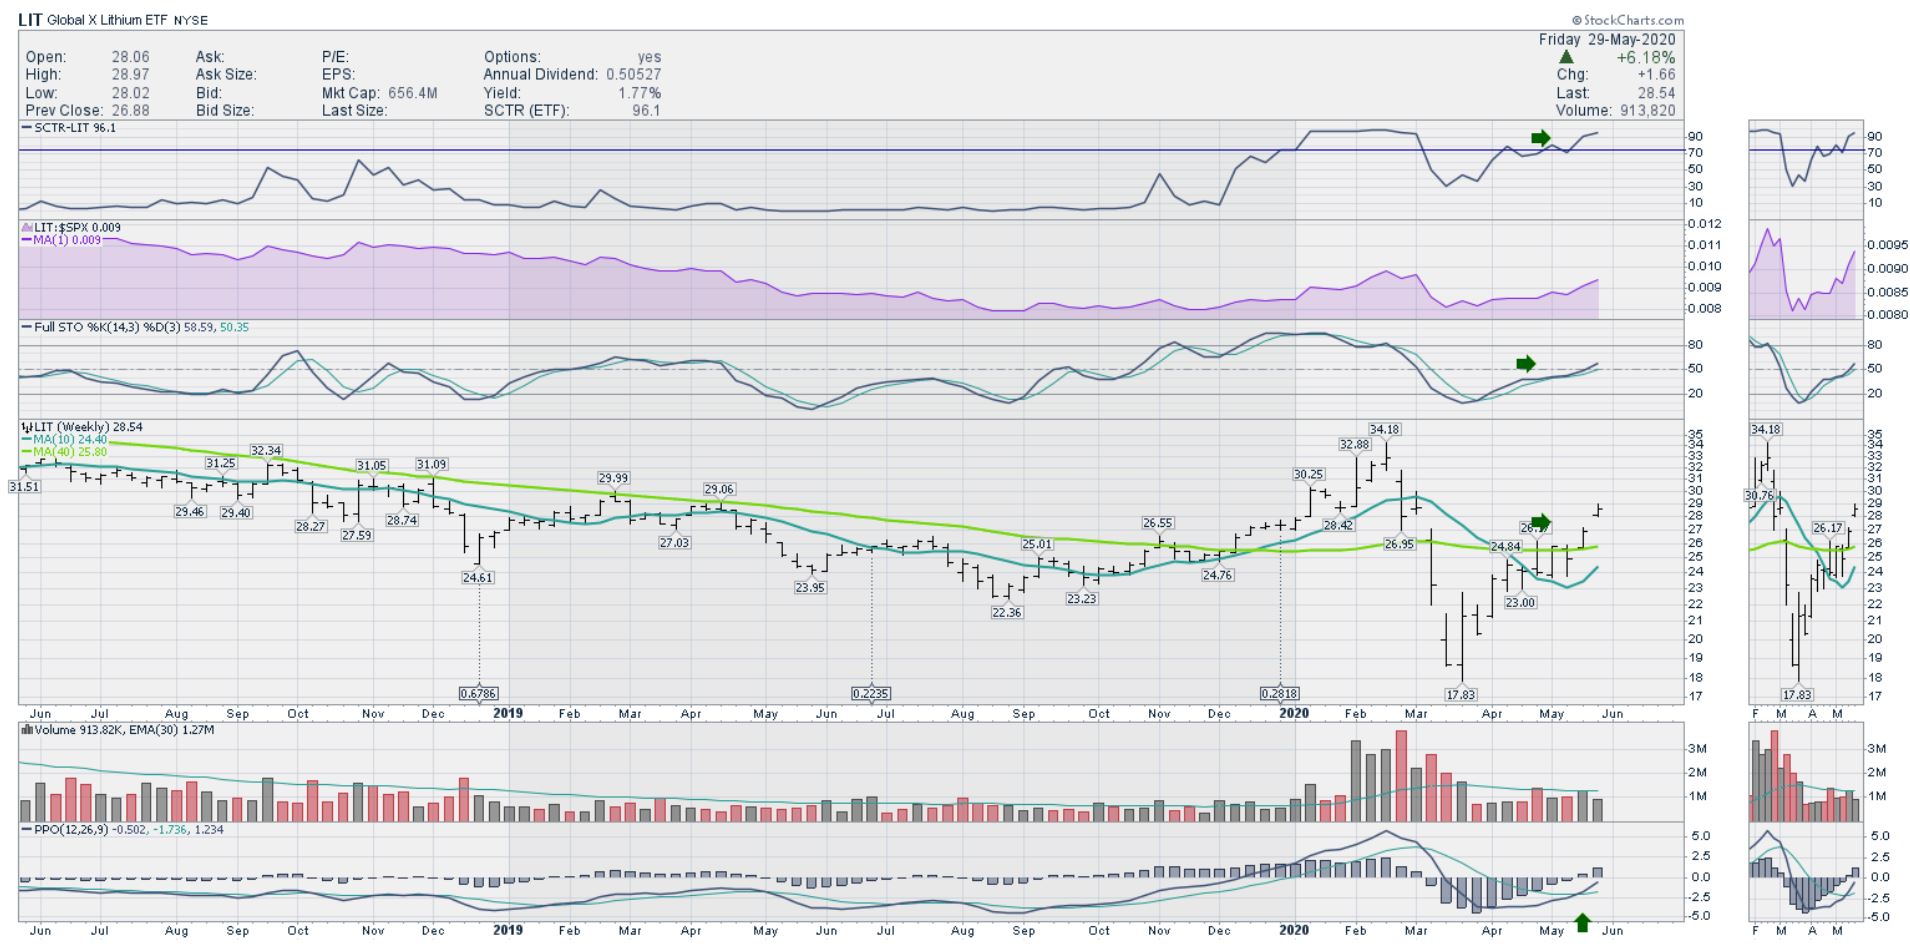
LITHIUM
Lithium is represented by this ETF LIT. The chart shows an explosive move this week. I expect this to be a solid backdrop as part of the whole electrical movement. Look at names like ALB, SQM, LAC, LAC.TO or just go with the ETF.
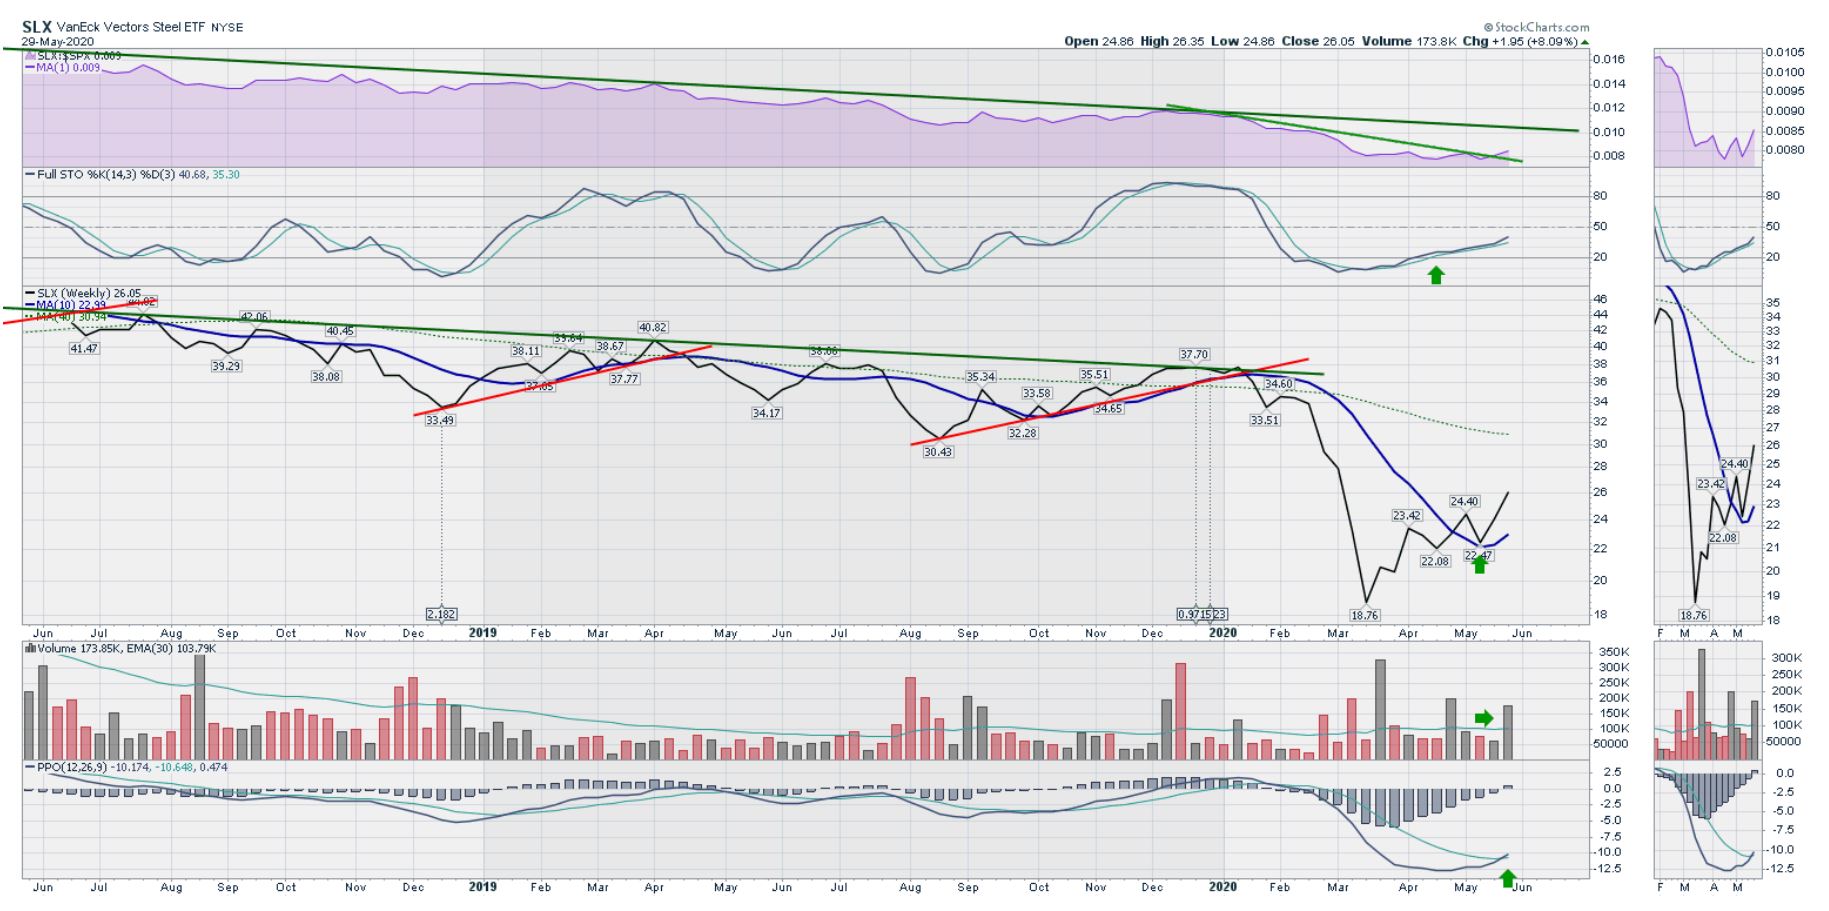
SLX – STEEL ETF IS ON THE MOVE
The steel ETF is well on its way. With the big move on steel this week it looks like a great opportunity to continue to ride the uptrend. Last weeks’ test of the 10-week moving average was successful. Now it looks like the chart is ready to head higher. Unfortunately, this ETF trades with light volume, but we can see that the big weeks up have significantly more volume than the average week. Bullish. GGB, ZEUS, TMK, CLF, WOR, ATI all had nice weeks. Make sure the uptrend continues or sell quickly.
OPEC+ TO MEET IN EARLY JUNE
Oil demand has been hit dramatically. Over the next week or two we should hear results from OPEC’s next meeting, expected to hold production at a lower level to encourage higher prices. As price starts to improve there will be some wells come back on stream. But limited availability to capital, as banks are stretched, means that we will probably have fewer new wells to add to supply over the next six months, slowly depleting excess inventory as conditions improve. The oil related charts look ready to pull back. We’ll see if OPEC+ can hold prices up. My target for crude by December is $50 which is 50% higher than here.

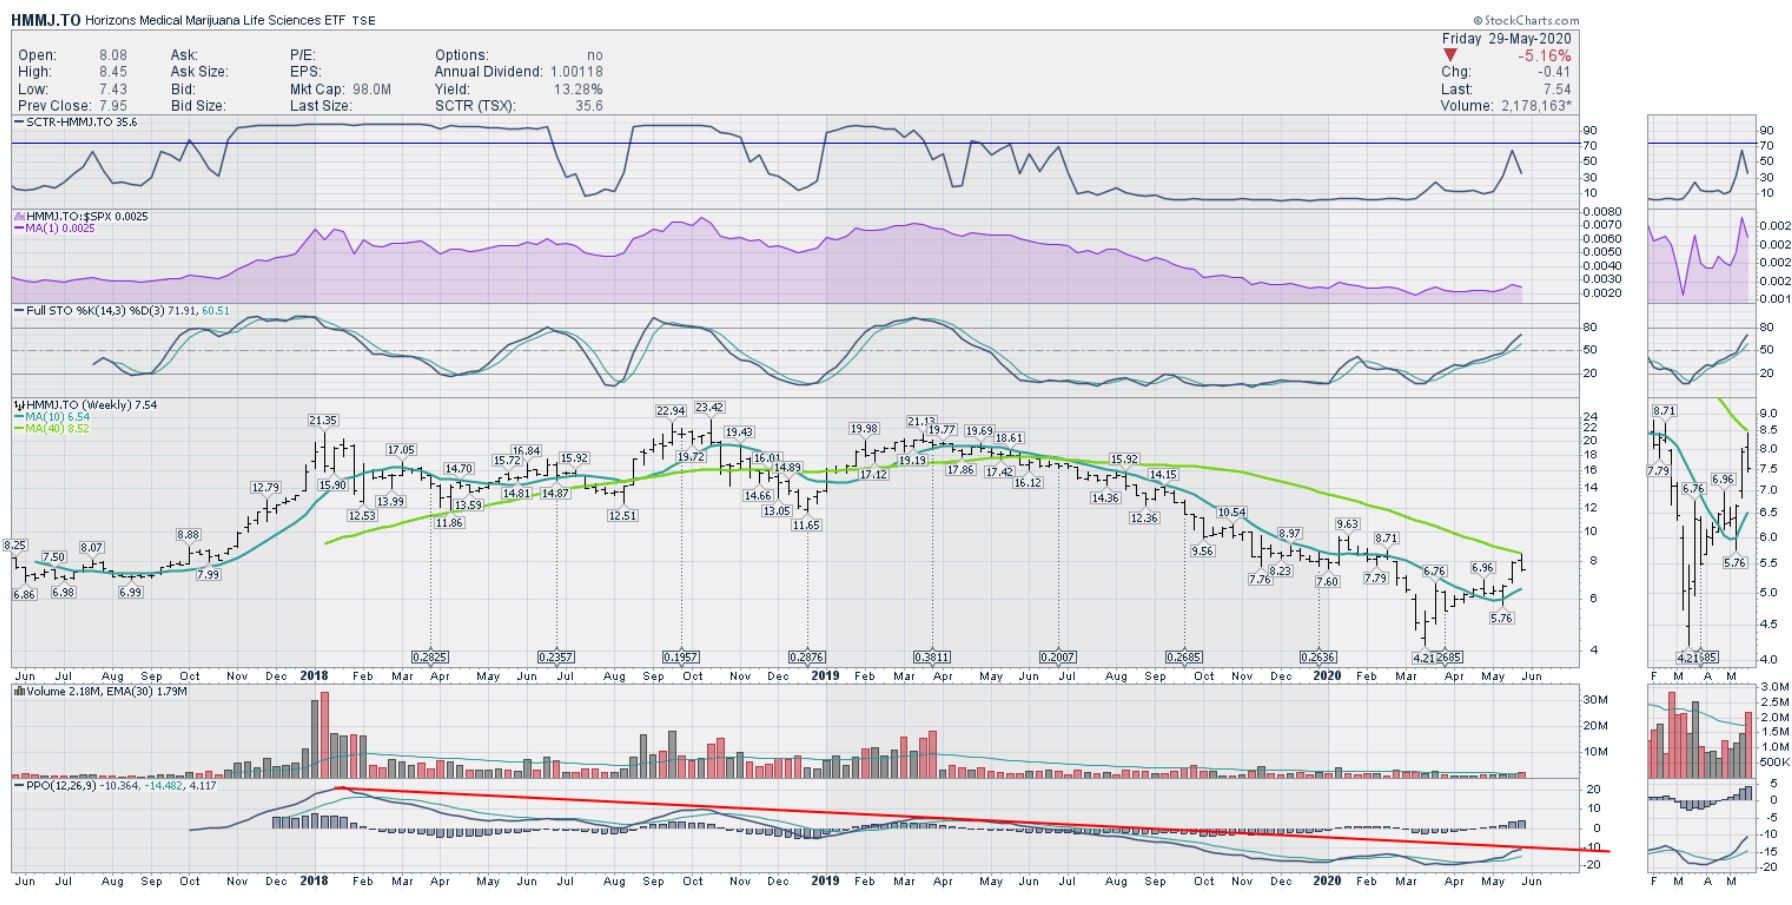
HMMJ.TO – MARIJUANA NAMES
The SCTR made it almost above 75 and is now pulling back. Looking to the far left of the screen, we saw the same SCTR action, then as price improved it rallied up. I still like individual names better than playing the ETF. The problem is that CGC didn’t behave very well this week on earnings. Perhaps it was a kitchen sink water where everybody is throwing things in under the blanket of COVID and now we can start to look to the upside with proper management in place. I am looking to buy as the charts set up.
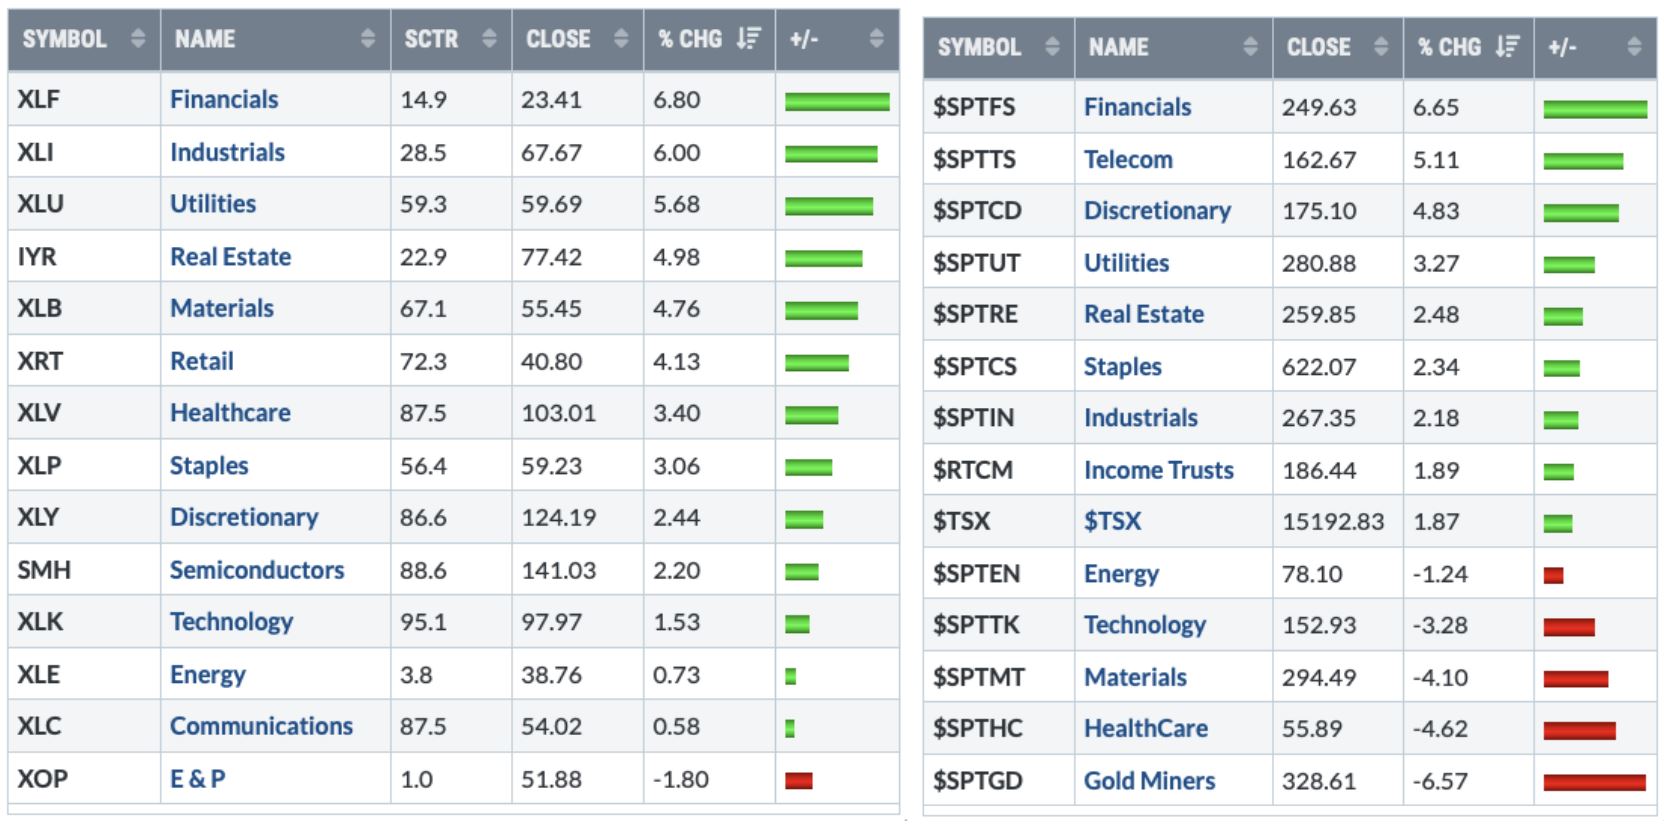
MARKET SUMMARY
The US market is on the left and the Canadian market is on the right. Once again, the Real Estate move was big. Tech and Communications were up but were some of the weakest areas of the market. Gold miners sold off hard after taking last week off too and momentum is now weakening. Utilities made a nice move this week and there are some nice charts there. Canadian industrials were not as powerful as the US industrials, but there are some nice bases forming. Pay close attention to materials.
GLOBAL VIEW
On the left, the world indexes were very positive for the second week. Japan and Europe stand out as big performers on the back of increased stimulus. I don’t know if Natural Gas could ever rally (arggh), but the chart is set up on the weekly to start.

